The visualization of awareness information in cultural contexts
|Visualization Tools: Group Information an Individual Information
As the article that I reviewed focuses on the effects of visualization tools on online participation in online learning environments, we need to figure out what visualization tools were used before explaining the cultural influences that may affect the effectiveness of the visualization tools. The use of the terminology visualization tool is likely to produce a misunderstanding that the author studied two softwares with different visualization forms. Actually, they are one visualization tool presenting different types of information. To be more specific, they are different awareness information, which "plays a role in making one’s activity visible to others" (Dourish, 1997, as cited in Sung-Hee, 2017). Nilsson and Svensson (2012) suggested that "awareness information on participation can support participation and learning in online learning communities." Therefore, the author laid the foundation of this study on the theory of awareness information. In this research, the awareness information is categorized into two types: 1) group participation and group interaction; 2) group participation and individual participation. Thus, this study aims to answer the question about which type of awareness information should be visualized to optimally encourage participation in collaborative online learning environments.
|Cultural Differences in Visual Preferences
In my critique, I recommend future research to focus on the effects of the visualization tools in different cultural contexts as the visual pattern, visual habits, and visual stimulus vary from culture to culture. The aforementioned three units can be concluded as visual preferences. In the field of user interface design, researchers hold a consensus view that there are connections between culture and visual preferences (Reinecke & Bernstein, 2013). Zooming in to the branch field of data visualization, which is more closely related to the topic of this study, we found that cultural dimensions are also emphasized by researchers and designers. “Data visuals can be interpreted differently based on cultural differences and, as a result, we interpret and react differently to the same stimulus” (Sheila, 2017).


The author used directed-force graphs with the elements (shape, color, texts), to present awareness information on participation and interaction. The audiences can see the relationships between nodes, and the focal points surrounded by subordinate points.
What if the sample of this study is American students? I think the effectiveness of these types of visualization tools will probably be affected. As the documentary West and East, Cultural Differences suggested, the westerners and the easterners tend to interpret visual information in different ways(Sheila, 2017). Four differences are discussed:

2) westerners look at categories, easterners look at relationships;
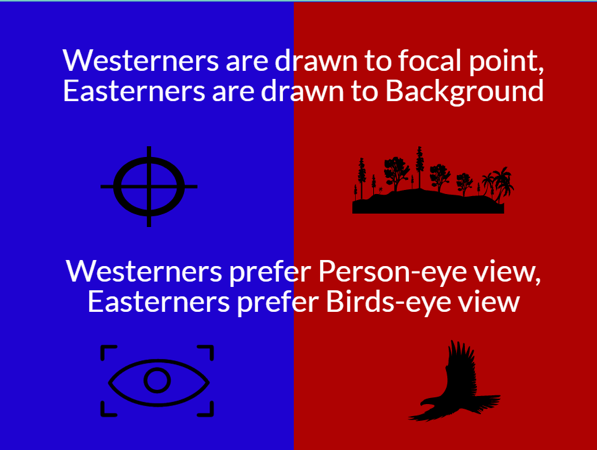
3) westerners are drawn to the focal point, easterners are drawn to the background;
4) westerners prefer a person-eye view, easterners prefer a bird-eye view.
|Cultural Dimension: Collectivism vs Individualism
Apart from the forms of information visualization, I think of a new perspective associated with one of the cultural dimensions: collectivism and individualism. We mentioned that this study visualized the awareness information, which consists of group awareness and object self-awareness. These two types of information concern the concepts of collectivism and individualism. The extent to which people are stimulated by group awareness information or object self-awareness may vary from culture to culture.

"Individualism values personal independence. An individualist’s sense of self is defined more by who they are on the 'inside,' minimizing the influence of factors, contexts, and people 'outside' the individual. Collectivism values personal interdependence. A collectivist’s sense of self is defined more by who they are with other people, or by their membership in a group." --- Intercultural Program USA
Accordingly, we can make assumptions that the visualization of individual participation in group-level and class-level probably encourages more participation of students from individualistic cultures than students from collectivistic cultures, and that group participation and individual interaction in group-level probably encourage more participation of students from collectivistic cultures than students from individualistic cultures.
|Reference
Intercultural Program USA. Individualism & Collectivism. Retrieved from https://www.afsusa.org/study-abroad/culture-trek/culture-points/culture-points-individualism-and-collectivism/Sheila R. (2017, December 19). GEDI Week: Cultural Considerations in Data Visualization. Retrieved from https://aea365.org/blog/gedi-week-cultural-considerations-in-data-visualization-a-gedi-take-by-mike-osiemo-mwirigi-and-glen-acheampong/
Sung-Hee Jin. (2017). Using Visualization to Motivate Student Participation in Collaborative Online Learning Environments. Journal of Educational Technology & Society, 20(2), 51-62. Retrieved November 1, 2020, from http://www.jstor.org/stable/90002163


Comments
Post a Comment